Baby Boomers, Gen X and Millennials have at least one thing in common – they all claim to be doing it tougher than the rest. Who is right? Data journalist Juliette O’Brien crunches the factors of generational fortune.
This story featured in Issue 9 of Forbes Australia. Tap here to secure your copy.
WEALTH GENERALLY follows the lifecycle. We get richer as we get older. So, it’s no surprise that older people hold a disproportionate share of the nation’s wealth. Gen X and Millennials are impatient for a bigger slice of the pie. Should they simply wait their turn? Or have they faced real financial generational disadvantages compared with Baby Boomers?
Today’s median age of Millennials is 35 years old (born 1981 to 1996). The Gen X equivalent turned 35 in 2008 (born 1965 to 1980), and the median Baby Boomer was 35 in 1990 (born 1946 to 1964).
We’ve compared key economic factors at these rough points in time* to find the generation that faced the toughest circumstances to build wealth.

Wealth
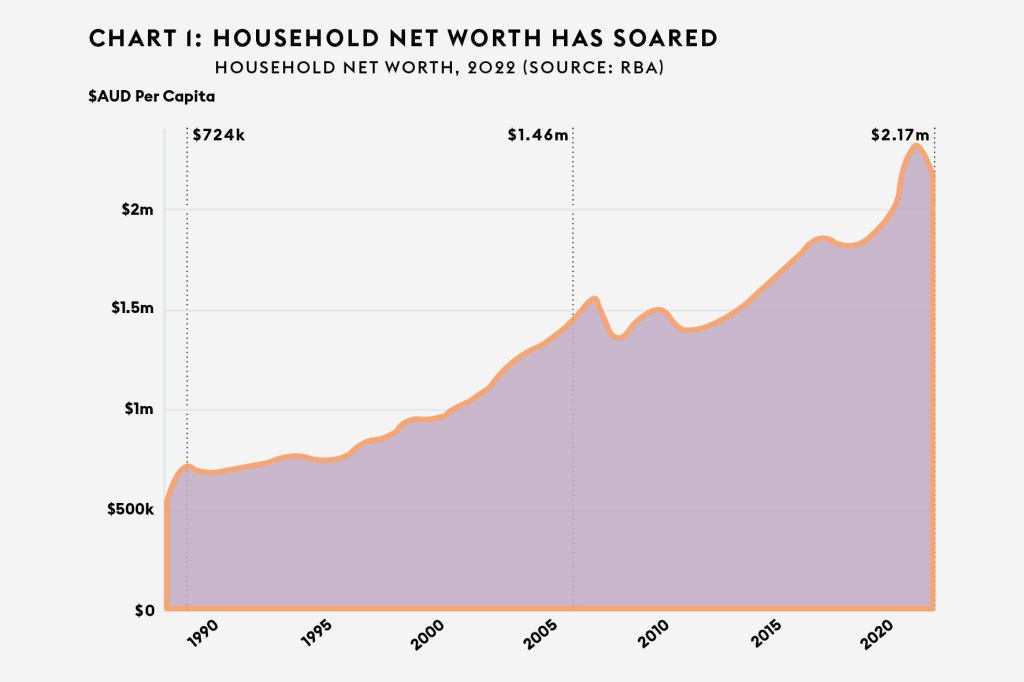
Regarding net worth, Gen X and Millennials have come of age during periods of greater prosperity. The current household net worth is 200% higher than when Baby Boomers were 35 years old. The household net worth for Gen X at the same age was 102% higher (Chart 1). The biggest driver of this growth is the value of property assets.
But net worth is a poor indicator of generational advantage because younger people have a smaller share of the riches (Chart 2). In 2018, Baby Boomers comprised roughly 34% of the population** while holding 46% of the wealth. Forty-somethings (covering most of Gen X) were about 22% of the population with 18% of the wealth. Thirty-somethings (a millennial proxy) were 23% of the population with just 12% of the wealth.
Income
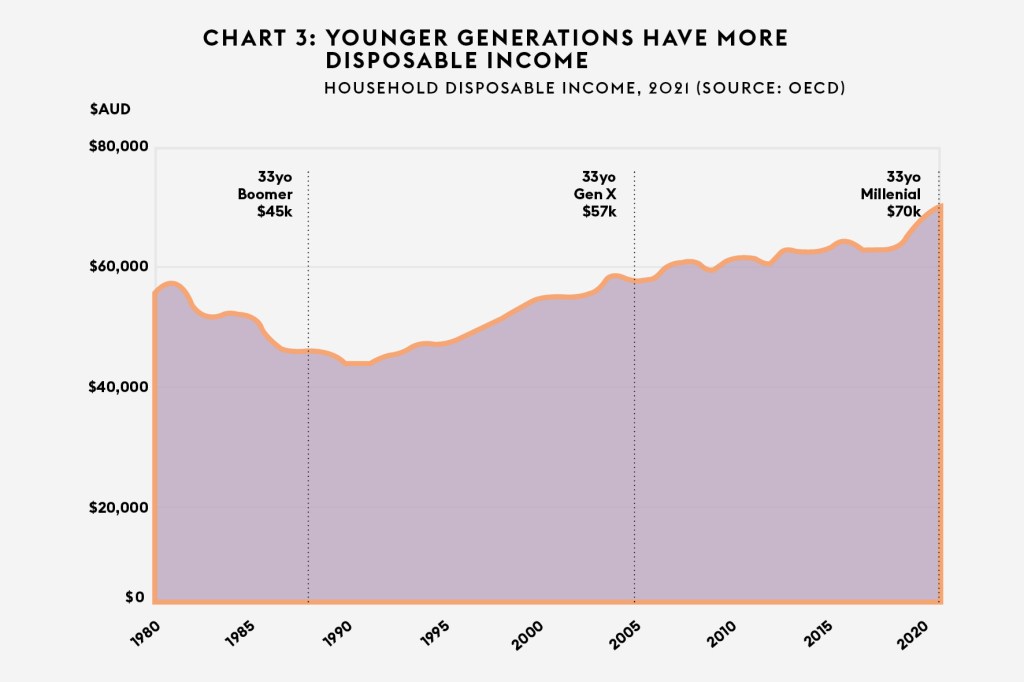
National disposable income data shows that an average household now has nearly $70,000 to spend yearly. That means a Millennial in their mid-thirties [assuming they constitute an average household] has 54% more real income than a Baby Boomer had in the same period. Gen X had 26% more (Chart 3).
Spending
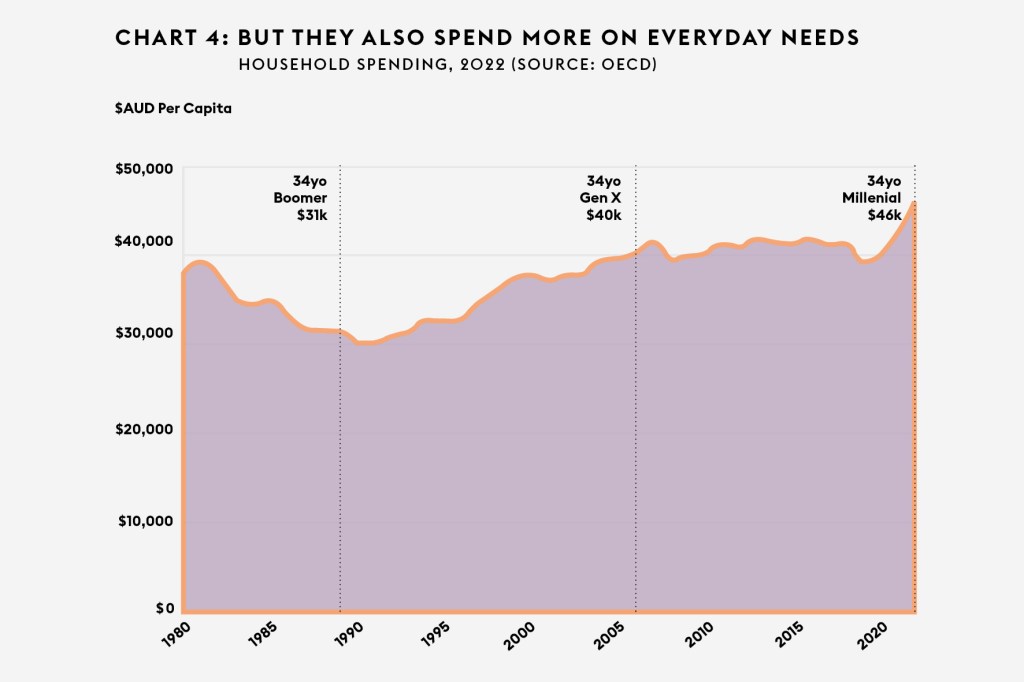
It’s a good thing they potentially have more money. They’ll need it. Millennials spend 48% more on ‘everyday needs’ such as food, clothing, housing, energy, and transport than Boomers. Gen X spent 28% more (Chart 4).
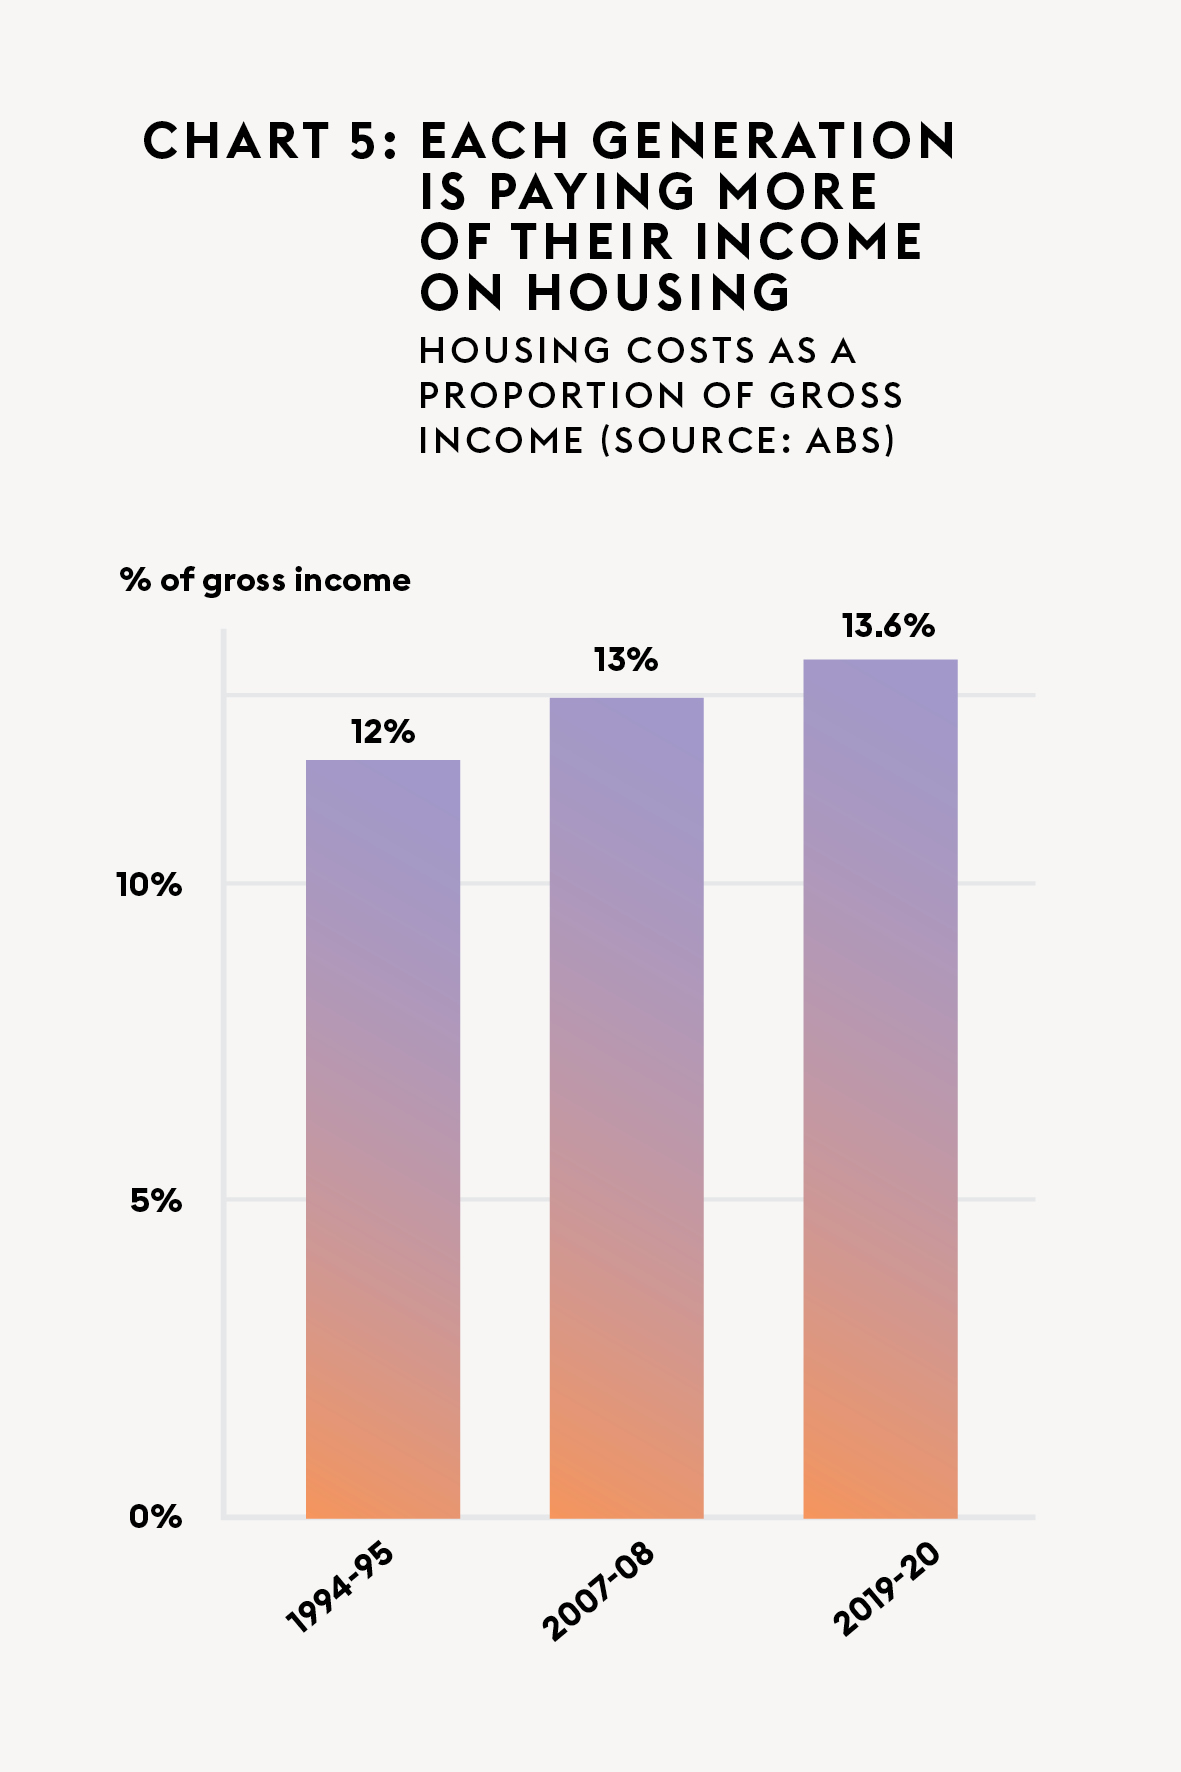
Where does the money go? Smashed avo on toast? The data lags the Reserve Bank’s 13 interest rate rises since May 2022, but the latest ABS data shows average housing costs as a proportion of gross income were 13.6% in 2020. In 2008, they were 13%, and in 1995 (the earliest available data) they were 12% (Chart 5).
Other notable areas of expenditure growth are energy and education (Chart 6). Millennials spend 60% more on electricity, gas and other fuels, while Gen X spent 42% more. Millennials spend 198% more on education, while Gen X spend 114% more.
Debt
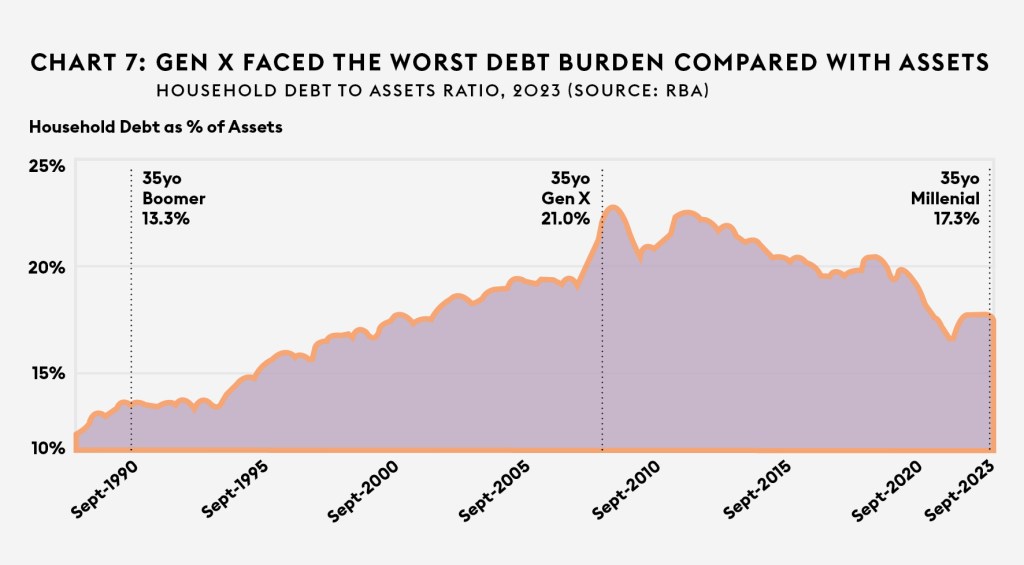
The RBA’s household debt-to-assets ratio shows Millennials are burdened with 30% more debt than Boomers at the same age. Generation X was even worse off, with 58% more debt (Chart 7).
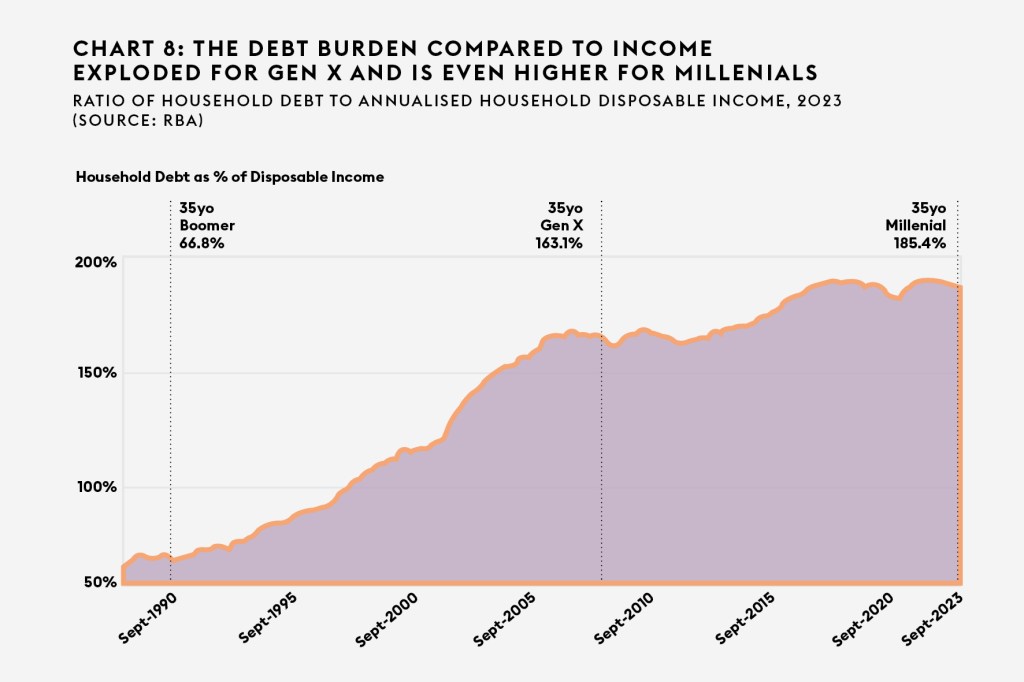
Meanwhile, the household debt-to-income ratio has exploded, with Millennials facing 178% more debt than Boomers and Gen X with 144% more (Chart 8).

Reality bites
Will the great wealth transfer save them?
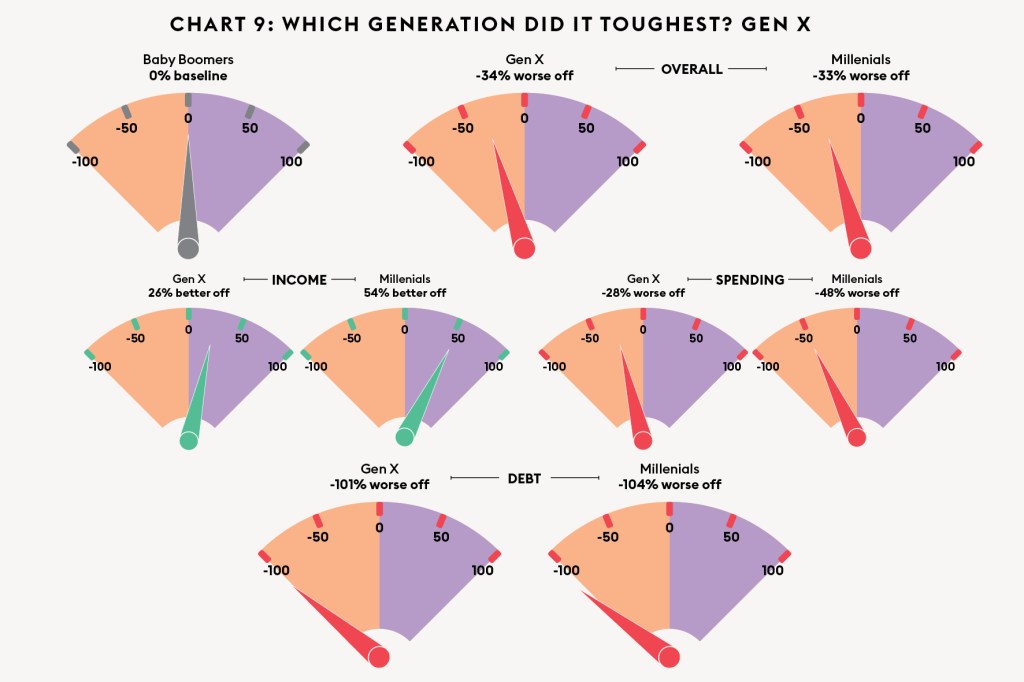
Generational well-being is broader than pure economics. But when it comes to these key factors that help build fortunes, Baby Boomers were generally better off, and Gen X was worse off overall (Chart 9). Reality really does bite. But remember, some of the critical data here is lagging the inflation spikes and interest rate hikes since 2022. Millennials may yet claim the Generation Grit title.
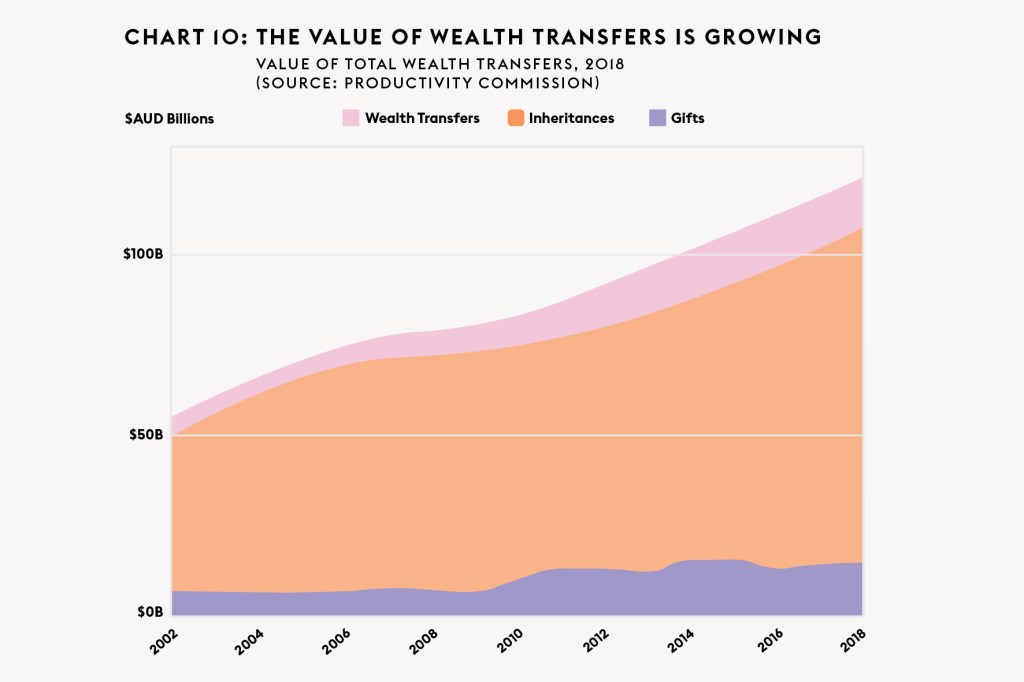
For these reasons, the huge intergenerational transfer – in which Gen X and Millennials will inherit their Baby Boomer parents’ disproportionate wealth – is so pivotal (Chart 10).
The transfer will not happen overnight. Inheritances generally flow to the next generation after both parents have died. The age when ‘children’ are most likely to lose their second parent is 64 to 74 years old. That’s still Boomer territory, whose median age today is 69.
Today’s median Gen Xer is 52 years old. They’ll have to wait about 12 years for the inheritance windfall to begin. The 35-year-old Millennial will wait nearly 30 years.
In the meantime, the Productivity Commission predicts that wealth inequality between generations will likely increase.
Data notes:
* The median Millennial age was calculated for each chart based on the most recent year available in the data. E.g. If data was from 2021, the median Millennial at the time was 33 years old. All comparisons are made for the same age across each generation.
** Based on population aged 30 to 99.
Chart 1: Household net worth is total assets minus liabilities. Indexed to 2022 prices. Median age: 34. Per capita adjustments made using ABS population data.
Chart 2: Population share based on people aged 30 to 99.
Chart 3: Household disposable income is all income minus tax and interest. Indexed to 2021 prices. Median age: 33.
Chart 4: Household spending includes food, clothing, housing, energy, transport, goods (notably cars), healthcare and leisure. Indexed to 2022 prices. Median age: 34. Per capita adjustments made using ABS population data.
Chart 5: Housing costs as a proportion of gross income. Data includes all households (owners and renters). Earliest and latest data, which do not correspond to equal median ages for each generation, have been used. In 1995, the median Boomer was 40 years old. In 2008, the median Gen Xer was 36. In 2020, the median Millennial was 32.
Chart 6: Select categories from the Household Final Consumption Expenditure in Australia’s National Accounts 2022 shown. Chain volume measures. Per capita adjustments were made using ABS population data.
Chart 7: Ratio of household debt to household assets (which include residential land and dwellings, consumer durables and financial assets). Median age: 35.
Chart 8: Ratio of household debt to annualised household disposable income. Median age: 35.
Chart 9: Calculations based on data detailed in Charts 2, 3, 8 and 9. Debt percentages are calculated as an average of debt-to-assets and debt-to-income ratios.
Chart 10: Estimates of the total value of wealth transfers based on the outflow measure of inheritances and reported value of gifts in Melbourne Institute’s Household, Income and Labour Dynamics in Australia (HILDA) Survey via Productivity Commission.
This story featured in Issue 9 of Forbes Australia. Tap here to secure your copy.