Most of Australia’s richest citizens made their money in just three sectors but these are not necessarily proportionate drivers of national wealth.
Data journalist Juliette O’Brien examines the billionaire-factory sectors and finds financial services and telcos punch above their weight when it comes to lining the public, rather than the private, pocket.
Key Takeaways
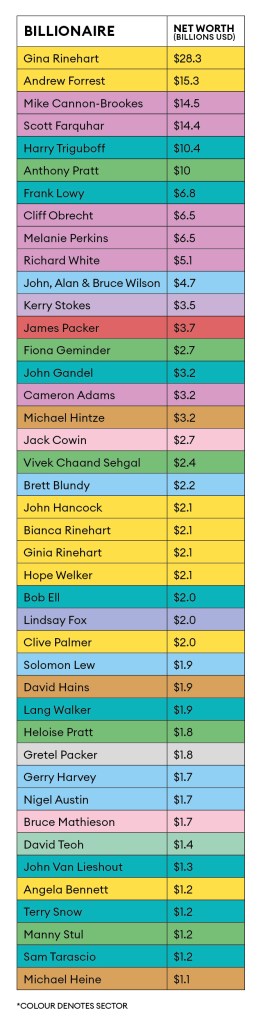
- Australia had 44 US-dollar-billionaires at the time of researching this article.
- Their collective net worth was US$186.7 billion.
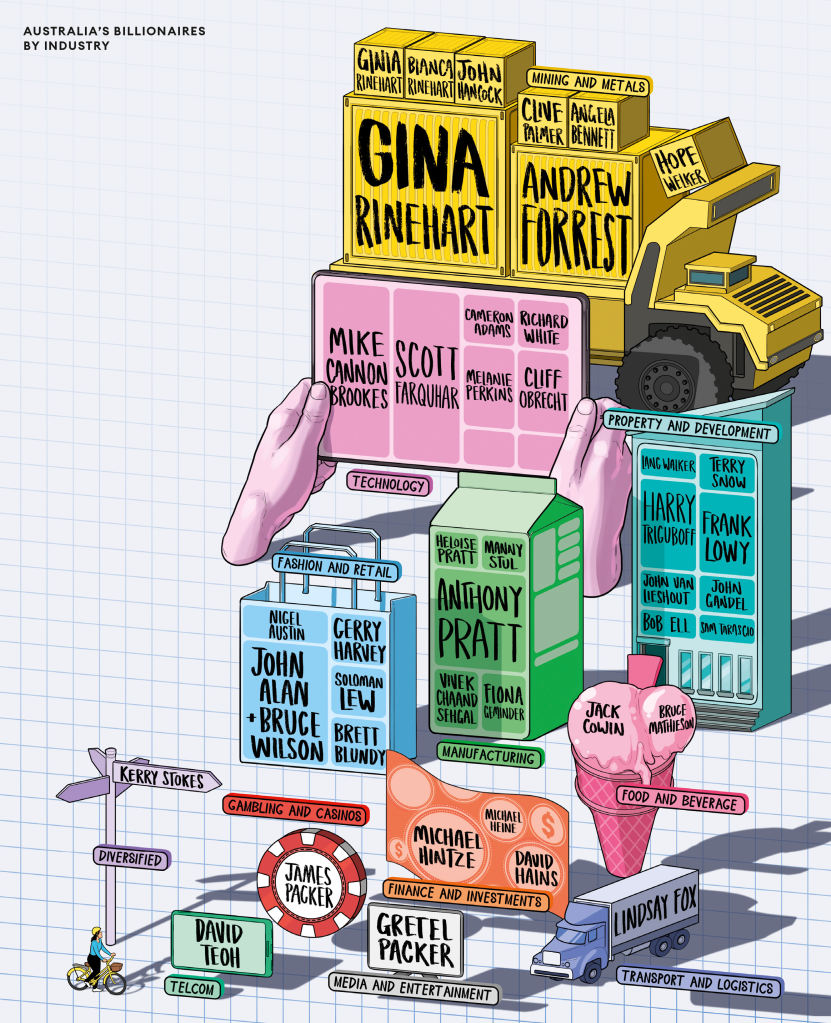
- Their fortunes were made across 11 industries but are concentrated in a small handful.
- 71% came from: mining, technology and property. 16% were from manufacturing and retail.
- It’s clear these industries drive individual prosperity. Do they benefit collective prosperity just as much?
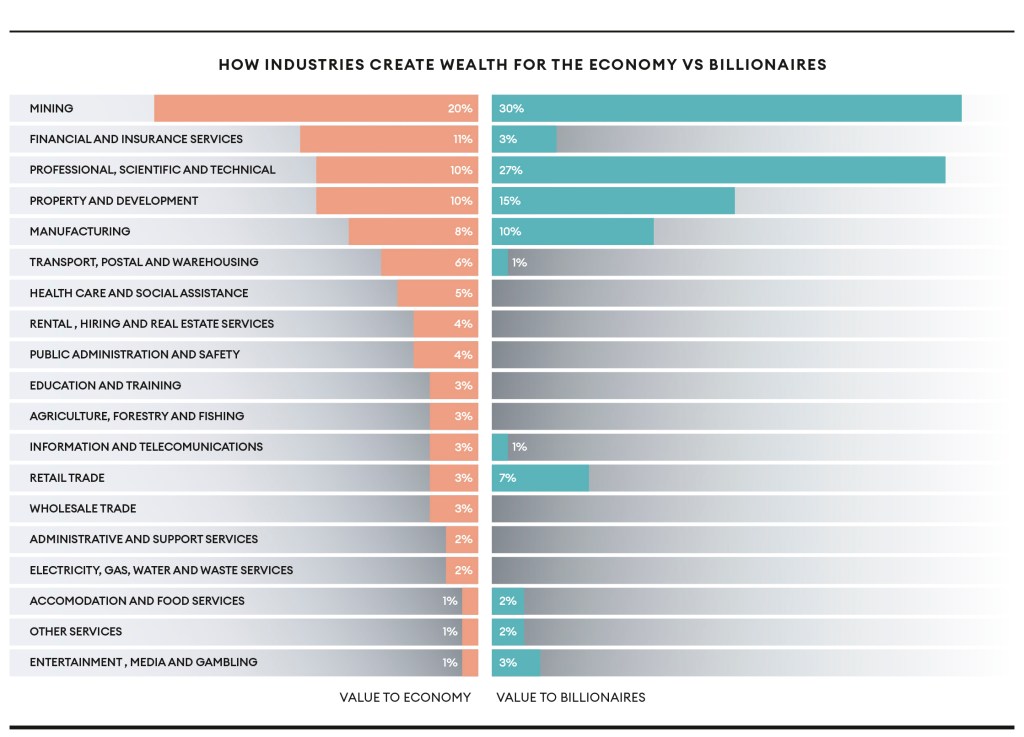
- We compared each sector’s contribution to billionaire net wealth against Gross Value Added (GVA*).
- As a proportion of total value, some sectors drive billionaire wealth far more than national wealth.
- Technology made 27% of billionaire wealth but less than 10% of Australia’s GVA.
- Mining made nearly 30% of billionaire wealth but 20% of GVA.
- The biggest difference was in gambling and entertainment, which made up almost 3% of billionaire wealth and 0.5% of GVA.
- In contrast, banking, finance, and insurance are strong engines for the national economy but not so much for individual fortunes.
- The sector made 3.3% of billionaire wealth and 11% of GVA.
- Telecommunications had a similar ratio with 0.75% of billionaire wealth and 3% of GVA.
*GVA is the measure of a sector’s contribution to the economy by net output measured by the value of goods and services produced.
Sources: Gross value added by market sector, Australian System of National Accounts, ABS, 2021; Forbes Real-Time Billionaires List, as at Sept. 5, 2022. Methodology: Industry contributions shown as percentages of totals (GVA: $2.87 trillion, billionaire net worth: $186.7 billion). Industry alignments are based on categories used in Australia’s National Accounts and Forbes. Some categories are not completely reconcilable but are aligned with their nearest match based on definitions via business.gov.au.