Silver’s rapid rise has pushed the gold-to-silver ratio to a level last seen in the wake of the Great Financial Crisis. What happens next?

By one measure, silver has caught up to gold. And then some.
The gold-to-silver ratio (the price of an ounce of gold divided by the price of an ounce of silver) has dropped below 50 for the first time since March 2012. In simple terms, that means silver is trading at its highest level relative to gold in nearly 14 years amidst a rally that has seen gold rise by more than 80% over the last year to $5,100 an ounce while silver has surged 250% to $110 an ounce, both all-time high prices.
Chalk the moves up to uneasy investors. Wars in Europe and the Middle East continue. Trade tensions between the U.S. and China are ramping up again. Confidence in the dollar is weakening as U.S. debt grows and inflation stays stubbornly above 2%. Meanwhile, political leaders are warning that the postwar global system is fraying. At the World Economic Forum in Davos last week, Canadian Prime Minister Mark Carney said the “rules-based international order” is breaking down. That system refers to decades of trade, security and financial cooperation built after World War II. When that order looks unstable, investors tend to look for assets they believe will hold value outside governments and currencies.
The last time the ratio dropped this low was March 2012. That period overlapped with the Federal Reserve’s Operation Twist. The Fed was trying to hold down long-term interest rates by buying $667 billion of long-term bonds and selling short-term ones. Operation Twist, considered the third round of quantitative easing, raised concerns that the central bank was running out of conventional tools and rewriting the rules of monetary policy. Lower yields made cash and bonds less attractive places to park money. Investors looked instead to assets they believed could hold value if easy money weakened the dollar. Gold and silver both climbed during that stretch.
The backdrop makes higher precious metals’ prices easy to understand. The speed of silver’s move relative to gold is harder to justify.
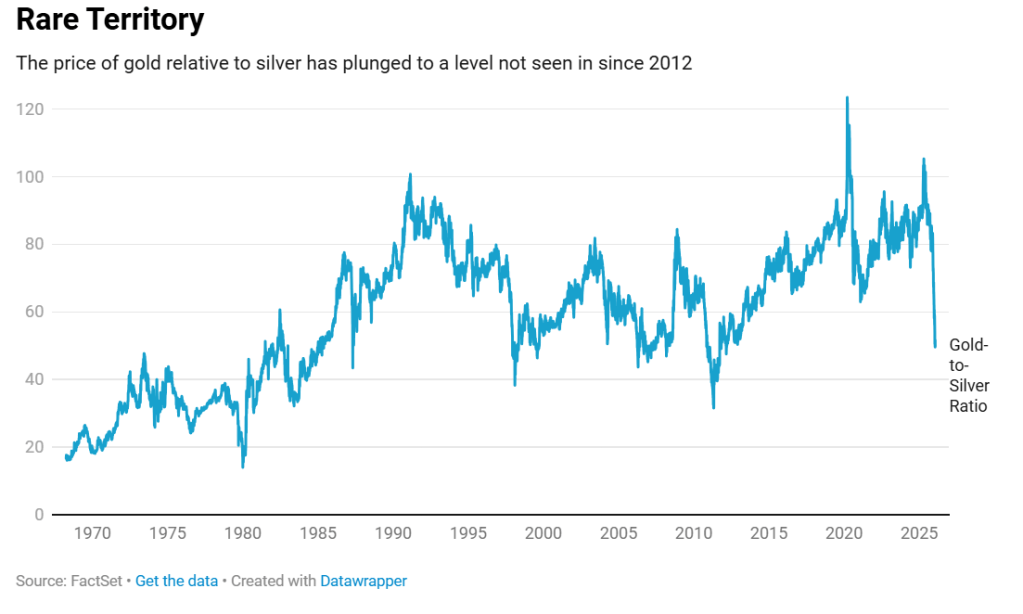
History shows how unusual this is. Since 1985, the ratio has averaged about 70 and has slipped below 50 on only about 6% of trading days. That does not mean it has to snap back right away, or at all. Wars, debt and inflation are still sending money into metals. Still, when a number almost never shows up, investors notice. And when enough of them do, it can start to shape what happens next.
So what would normalization of the gold-to-silver ratio look like right now?
The numbers can rebalance in two directions. If gold does not move much from around $5,100 an ounce, silver would have to fall to about $72 to restore the long-term average ratio of 70. That would be a drop of roughly 35%. If silver stays at $110 instead, gold would have to climb to about $7,700 an ounce.
Look back on the week that was with hand-picked articles from Australia and around the world. Sign up to the Forbes Australia newsletter here or become a member here.
This story was originally published on forbes.com and all figures are in USD.