Australia’s housing market is increasingly unaffordable. But is it exceptional? Data journalist Juliette O’Brien analyses like-for-like global data and finds Australia is less extreme than headlines suggest.
This story features in Issue 22 – out now. Tap here to secure your copy.
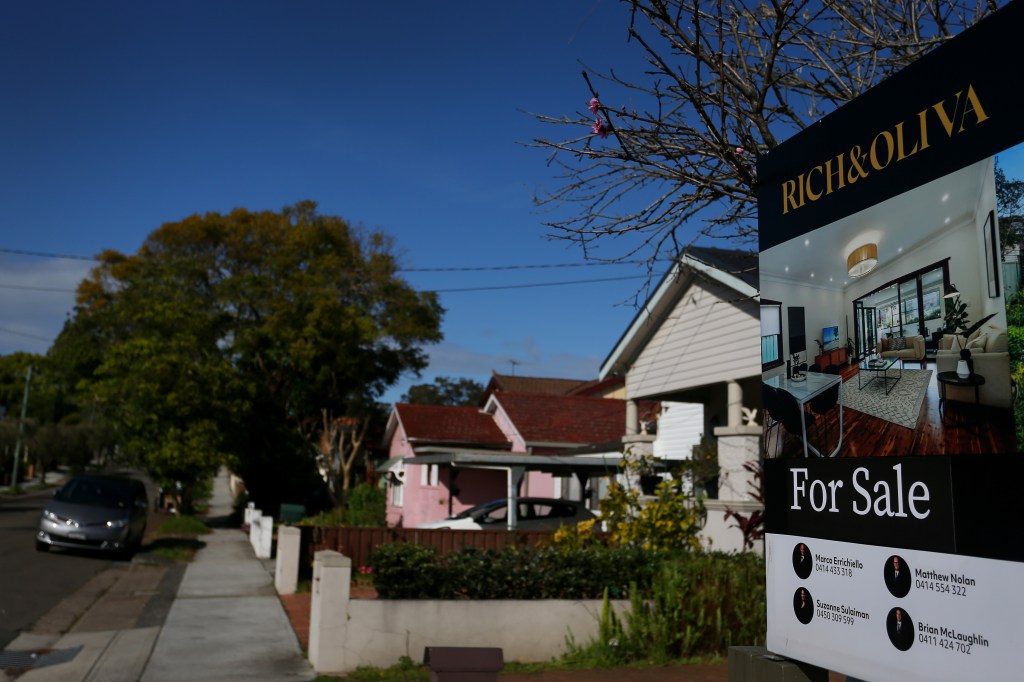
Australia’s housing affordability sank to new lows in 2025, according to Cotality. The median house price reached 8.9 times annual income, up from 6.6 five years earlier. A new loan devours 45% of the median household salary. Saving a standard 20% deposit now stretches to nearly 12 years.
Australia’s most expensive market, Sydney, stands out as acutely expensive. By March 2026, the median home cost almost $1.3 million – around 40% above the national median of $922,838.
The Demographia International Housing Affordability Report compares 94 markets across eight countries. On its core measure of median price-to-income, Sydney ranked as the second least affordable city, behind Hong Kong. Hong Kong’s price-to-income ratio stands at 16.7, while Sydney’s is 13.8. Melbourne and Brisbane follow in 7th and 13th place, at 9.8 and 8.1. (Chart 1).
On this measure, Australia looks expensive by global standards. But it does not account for differences in the housing itself.
Global Property Guide offers a broader comparison, analysing median asking prices for apartments across 408 markets in 80 countries. Sydney CBD records a median of $1.65m for a two-bedroom unit, ranking 8th globally. Across Greater Sydney, the median falls to $970,080, placing it 45th. (Chart 2; not all markets shown).
The Gold Coast, which is often buried in ‘regional Queensland’ in national data, records $869,970, ranking 56th. That puts it above every capital city except Sydney.
Another comparable measure is price per square metre. A 2025 Deutsche Bank report, using Numbeo data, compares average apartment prices across 69 markets. A Forbes analysis benchmarks each city against Sydney, Australia’s most expensive, where apartments average $18,477 per square metre.
Thirteen cities are more expensive. Hong Kong leads at $36,584 – almost double. It is followed by Zurich, Singapore, Seoul, Geneva, London, New York, Tel Aviv, Beijing, Shanghai, Taipei, Paris and Munich. Melbourne, at $9,917 per square metre, is 46% cheaper than Sydney.
Income helps explain why affordability feels so strained in Australia, but only in part.
Data from Deutsche Bank and Numbeo on net monthly pay puts Sydney at $6,077. In 10 cities, residents face higher property prices and lower incomes: Hong Kong, Singapore, Seoul, London, Tel Aviv, Beijing, Shanghai, Taipei, Paris and Munich (Chart 3, bottom-right quadrant). Charts 4 and 5 zoom in on the bottom-left quadrant. A further 27 cities offer cheaper property, but the pay gap leaves residents worse off than those in Sydney. In Mumbai, prices per square metre are nearly 50% lower, yet average income is more than 80% lower. The same pattern appears in Moscow, Bangkok, Milan and Lisbon (Chart 4).
Melbourne, by contrast, looks markedly better off than Sydney: incomes are just 4% lower, while prices per square metre are 46% lower. It sits within a group of cities where lower prices outweigh lower salaries (Chart 5). Income does not fully explain the squeeze. Another factor sits in plain sight: size.
Australian homes rank among the largest in the world. A 2020 CommSec comparison put new dwellings (houses and apartments combined) at about 195 square metres on average, similar to the United States. In Canada, homes averaged 141 square metres. In the United Kingdom, they were just 96 square metres in 2023, according to Nationwide Building Society. An Our World in Data analysis of the world’s 100 largest cities ranks Sydney last for population density, at 3,121 people per square kilometre. Mumbai tops the list at 26,696 – around nine times higher. No other Australian cities feature in the sample.
Australians also favour houses over units. OECD data shows 84% of dwellings are houses, compared with 67% in the United States and 65% in Canada (Chart 6, previous page). Census data from the ABS shows the same pattern locally: houses make up 66% of dwellings in Greater Sydney and 81% in Greater Melbourne. That preference carries a higher entry price. By March 2026, the national median house value reached $1,005,418, compared with $741,404 for units, according to Cotality. In Sydney, the gap widens further: houses hit $1,607,046, while units sit at $903,080. This shapes affordability.
The price-to-income ratios in Chart 1 reflect the dominant dwelling type in each market. In Australian cities, that is houses. Australia’s housing market is increasingly expensive, and the pressure on first-home buyers is real. But part of the strain reflects what Australians buy: large houses, built at low density, on scarce urban land. When global markets are measured on equal terms, even the country’s most expensive city sits closer to the middle.
*DATA NOTES: US dollars in data sources converted to Australian dollars at exchange rate on 18 March 2026 ($1.41). Data from Deutsche Bank uses crowdsourced data from Numbeo, a free online database that compares cost of living worldwide.
Data sources: Global Property Guide, March 2026; Demographia International Housing affordability 2024; Deutsche Bank Research Institute Mapping the World’s Prices, 2025; OECD Affordable Housing Database, 2024.
This article represents the views only of the subject and should not be regarded as the provision of advice of any nature from Forbes Australia. The article is intended to provide general information only and does not take into account your individual objectives, financial situation or needs. Past performance is not necessarily indicative of future performance. You should seek independent financial and tax advice before making any decision based on this information, the views or information expressed in this article.
Want to see more Forbes articles on your feed? Tap here to make Forbes Australia a preferred source on Google.
Look back on the week that was with hand-picked articles from Australia and around the world. Sign up to the Forbes Australia newsletter here or become a member here.